Tip of the Week: Diagrams as Code
Tip of the Week: Diagrams as Code
Each week we seek to provide a software tip of the week geared towards helping you achieve your software goals. Views expressed in the content belong to the content creators and not the organization, its affiliates, or employees. If you have any software questions or suggestions for an upcoming tip of the week, please don’t hesitate to reach out to #software-engineering on Slack or email DBMISoftwareEngineering at olucdenver.onmicrosoft.com
Diagrams can be a useful way to illuminate and communicate ideas. Free-form drawing or drag and drop tools are one common way to create diagrams. With this tip of the week we introduce another option: diagrams as code (DaC), or creating diagrams by using code.
TLDR (too long, didn’t read); Diagrams as code (DaC) tools provide an advantage for illustrating concepts by enabling quick visual positioning, source controllable input, portability (both for input and output formats), and open collaboration through reproducibility. Consider using Mermaid (as well as many other DaC tools) to assist your diagramming efforts which can be used directly, within in your markdown files, or Github commentary using code blocks (for example, ` ```mermaid `).
Example Mermaid Diagram as Code
flowchart LR
    a --> b
    b --> c
    c --> d1
    c --> d2
Mermaid code
flowchart LR
    a --> b
    b --> c
    c --> d1
    c --> d2
Mermaid rendered
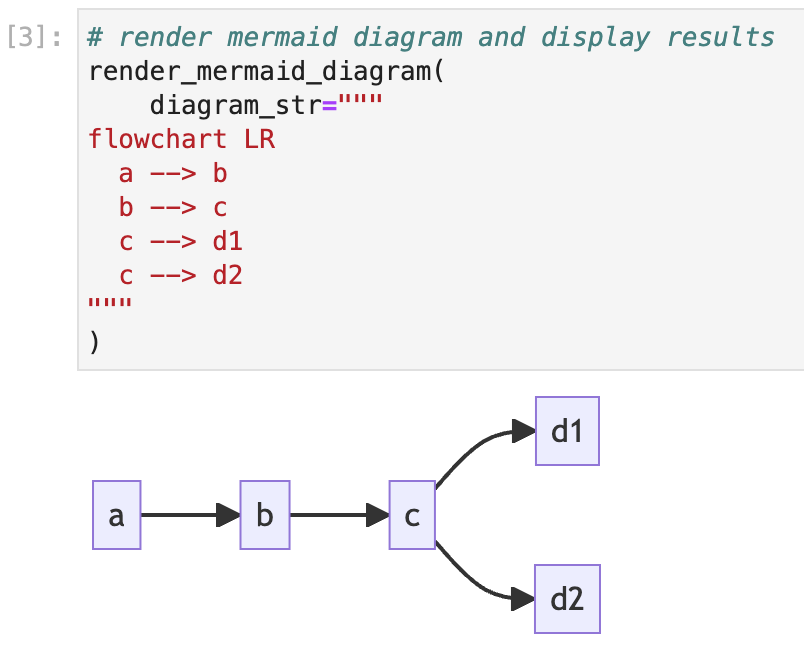
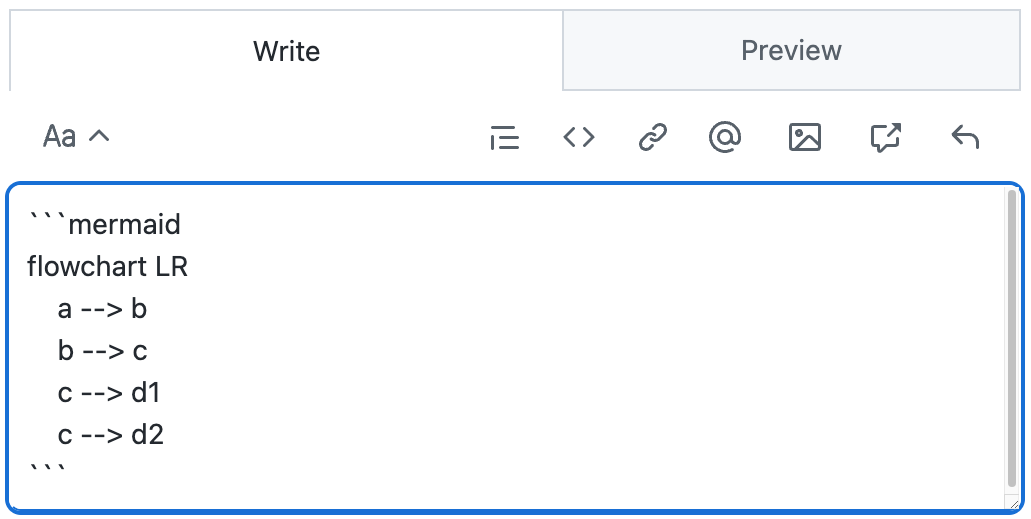
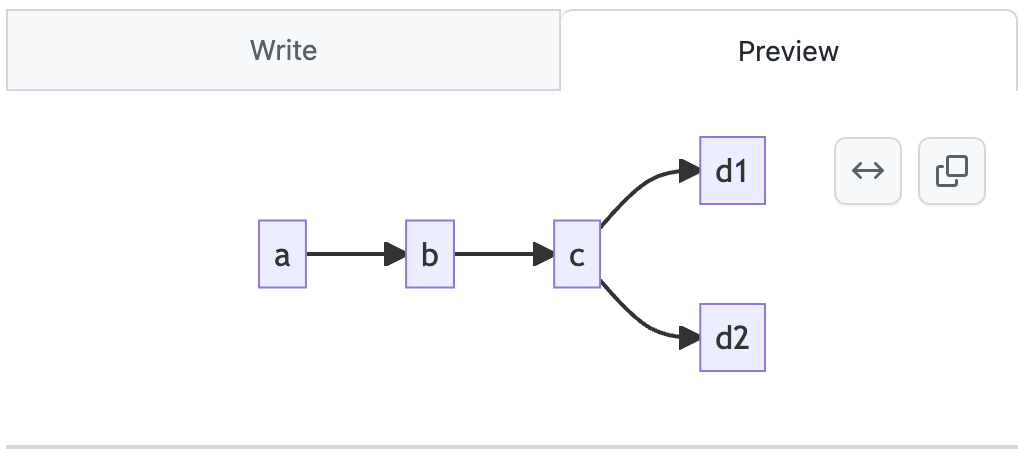
The above shows an example mermaid flowchart code and its rendered output. The syntax is specific to mermaid and acts as a simple coding language to help you depict ideas. Mermaid also includes options for sequence, class, Gantt, and other diagram types. Mermaid provides a live editor which can be used to quickly draft and share content.
Mermaid Github Integration
Mermaid diagrams may be rendered directly from markdown (.md) and text communication content (like pull request or issue comments) within Github. See Github’s blog post on mermaid for more details covering this topic.
Mermaid Jupyter Notebook Integration

Mermaid diagrams can be rendered directly within Jupyter notebooks with a small amount of additional code and a rendering service. One way to render mermaid and other diagrams within notebooks is to use Kroki.io. See this example for an interactive demonstration.
Version Controlling Your Diagrams
graph LR
    subgraph Compose
      write[Write Diagram Code]
      render[Render Diagram]
    end
    subgraph Store[Save and Share]
      save[Upload Diagram]
    end
    write --> | create | render
    render --> | revise | write
    render --> | code and exports | save
Mermaid version control workflow example
Creating your diagrams with code means you can enable reproducible and collaborative work on version control systems (like git). Using git in this way allows you to reference and remix your diagrams as part of development. It also allows others to collaborate on diagrams together making modifications as needed.
Additional Resources
Please see the following the additional resources which are related to diagrams as code.


